We review major tools and packages for Social Network Analysis and visualization, which have wide applications including biology, finance, sociology, network theory, and many other domains.
-
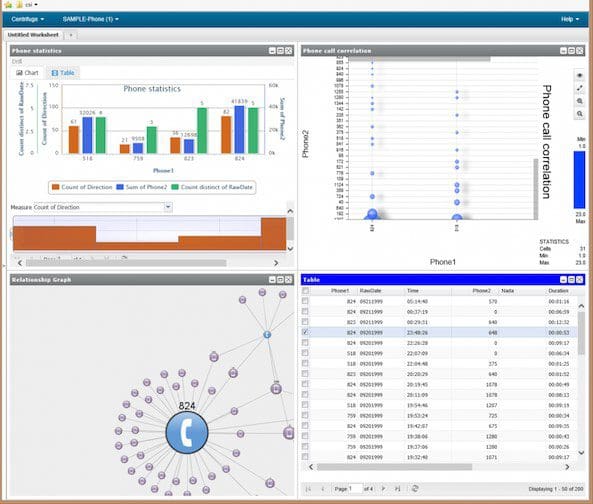
Centrifuge offers analysts and investigators an integrated suite of capabilities that can help them rapidly understand and glean insight from new data sources, visualize discoveries by interacting with data, collaborate to draw conclusions.
-
Commetrix is a Software Framework for Dynamic Network Visualization and Analysis that supports Community Moderators, Members, and Network Researchers. Commetrix is an exploratory analysis tool for dynamic network data. Its connectors can conveniently read all sources of accessible network data, like co-authorship or business process networks. Still, the focus is on analyzing evolving patterns of electronic communication, including e mail, discussions, voice over IP, and instant messaging.
-
Cuttlefish is a network workbench application that visualizes the networks with some of the best known layout algorithms. It allows detailed visualizations of the network data, interactive manipulation of the layout, graph edition and process visualization as well as different input methods and outputs in TeX using Tikz and PSTricks. It can be downloaded as jar archive and can used with Gephi too.
-
Cytoscape is an open source software platform for visualizing molecular interaction networks and biological pathways and integrating these networks with annotations, gene expression profiles and other state data.Although Cytoscape was originally designed for biological research, now it is a general platform for complex network analysis and visualization. Cytoscape core distribution provides a basic set of features for data integration, analysis, and visualization. Additional features are available as Apps (formerly called Plugins). Apps are available for network and molecular profiling analyses, new layouts, additional file format support, scripting, and connection with databases.
-
EgoNet is a program for the collection and analysis of egocentric network data. It helps you create the questionnaire, collect data and provide general global network measures. In addition, data matrices can be used for a more extensive analysis by other software. Once the interview is completed, the network can be immediately visualized, allowing the interviewer to ask further questions about the network. Other utilities include combining personal networks into a single whole network.
-
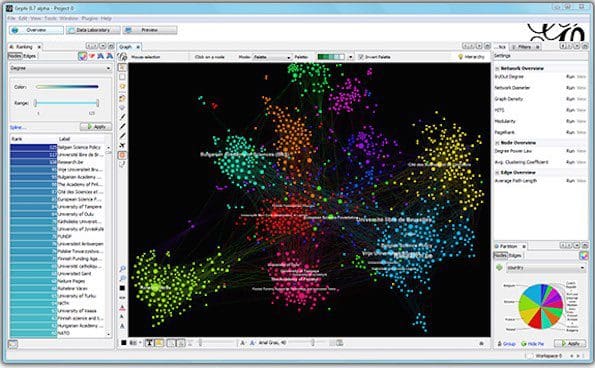
Gephi is an interactive visualization and exploration platform for all kinds of networks and complex systems, dynamic and hierarchical graphs. Runs on Windows, Linux and Mac OS X. Gephi is open-source and free. Gephi is a tool for people that have to explore and understand graphs. Like Photoshop but for data, the user interacts with the representation, manipulate the structures, shapes and colors to reveal hidden properties.

-
Graph-tool is an efficient Python module for manipulation and statistical analysis of graphs (a.k.a. networks). Contrary to most other python modules with similar functionality, the core data structures and algorithms are implemented in C++, making extensive use of template meta-programming, based heavily on the Boost Graph Library. Graph-tool has its own layout algorithms and versatile, interactive drawing routines based on cairo and GTK+, but it can also work as a very comfortable interface to the excellent graphviz package.
-
GraphChi is a spin-off of the GraphLab project (now renamed to Dato) from the Carnegie Mellon University. It is to bring web-scale graph computation, such as analysis of social networks, available to anyone with a modern laptop. It saves you from the hassle and costs of working with a distributed cluster or cloud services. Programs for GraphChi are written in the vertex-centric model, proposed by GraphLab and Google’s Pregel.
-
Graphviz is open source graph visualization software. Graph visualization is a way of representing structural information as diagrams of abstract graphs and networks. The Graphviz layout programs take descriptions of graphs in a simple text language, and make diagrams in useful formats, such as images and SVG for web pages; PDF or Postscript for inclusion in other documents; or display in an interactive graph browser. Graphviz has many useful features for concrete diagrams, such as options for colors, fonts, tabular node layouts, line styles, hyperlinks, and custom shapes.
-
InFlow performs network analysis AND network visualization in one integrated product. It is one of the early tools in SNA which has survived because of its ease of use and interactive interface. It is a bit more pricey, but it comes with coaching and support by Valdis. You need to contact Valdis (you can do so through this web site) for current pricing and features.
-
JUNG(Java Universal Network/Graph Framework) is a software library that provides a common and extensible language for the modelling, analysis, and visualization of data that can be represented as a graph or network. The JUNG architecture is designed to support a variety of representations of entities and their relations, such as directed and undirected graphs, multi-modal graphs, graphs with parallel edges, and hypergraphs. It provides a mechanism for annotating graphs, entities, and relations with metadata.
-
Keynetiq is an innovative platform for Organizational Network Analysis. It’s designed to map, visualize and analyze networks of people and relations between them, revealing how organizations really operate in day-to-day business. It provide a complete range of services ranging from the analysis of your objectives and the design of an ONA study, implementation of the Keynetiq tool, coordination of data gathering and administration of the platform, right up to a full analysis of your organizational network and a detailed report complete with an action plan.
-
MeerKat offers facilities for automated community mining, various layout algorithms for helpful visualizations, and timeframe event analysis for dynamic networks that have been observed at multiple points in time. Meerkat carefully lays the network out on the screen to minimize occlusion and highlights communities. It also provides information about the most influential/central nodes within each community.
-
Netlytic is a cloud-based text and social networks analyzer that can automatically summarize large volumes of text and discover social networks from online conversations on social media sites such as Twitter, Youtube, blogs, online forums and chats. Multi-tier subscription including free version.
-
NetMiner is an application software for exploratory analysis and visualization of large network data based on SNA. It has embed internal Python-based script engine which equipped with the automatic Script Generator. NetMiner 4 license for coursework is provided to students and teachers.
-
Network Workbench is a Large-Scale Network Analysis, Modeling and Visualization Toolkit for Biomedical, Social Science and Physics Research. The envisioned data-code-computing resources environment will provide a one-stop online portal for researchers, educators, and practitioners interested in the study of biomedical, social and behavioral science, physics, and other networks.
-
NetworKit is a growing open-source toolkit for high-performance network analysis. Its aim is to provide tools for the analysis of large networks in the size range from thousands to billions of edges. For this purpose, it implements efficient graph algorithms, many of them parallel to utilize multicore architectures. These are meant to compute standard measures of network analysis, such as degree sequences, clustering coefficients and centrality. In this respect, NetworKit is comparable to packages such as NetworkX, albeit with a focus on parallelism and scalability.
-
NetworkX is a Python language software package for the creation, manipulation, and study of the structure, dynamics, and functions of complex networks. With NetworkX you can load and store networks in standard and nonstandard data formats, generate many types of random and classic networks, analyze network structure, build network models, design new network algorithms, draw networks. It is used by mathematicians, physicists, biologists, computer scientists, and social scientists.
-
NodeXL is a free, open-source template for Microsoft® Excel® that makes it easy to explore network graphs. With NodeXL, you can enter a network edge list in a worksheet, click a button and see your graph, all in the familiar environment of the Excel window. Flexible Import and Export Import and export graphs in GraphML, Pajek, UCINet, and matrix formats. Direct Connections to Social Networks Import social networks directly from Twitter, YouTube, Flickr and email, or use one of several available plug-ins to get networks from Facebook, Exchange, Wikis and WWW hyperlinks.
-
Pajek is a program, for Windows, the main motivation for development of Pajek was the observation that there exist several sources of large networks that are already in machine-readable form. Pajek should provide tools for analysis and visualization of such networks: collaboration networks, organic molecule in chemistry, protein receptor interaction networks, genealogies, Internet networks, citation networks, diffusion (AIDS, news, innovations) networks, data-mining (2-mode networks), etc. It is extensively used in academic research.
-
Polinode is a flexible tool that helps cut through complexity. At its core is the ability to map, visualize and analyze network data. Targeted mainly at organizations and consultants, applications range from identifying change agents and finding critical links through to promoting diversity and improving workplace layouts
-
R is a general purpose analytics tool, but several libraries are available for social network analysis. These include degreenet, RSeina, PAFit, igraph, sna network, tnet, ergm, Bergm, hergm, latentnet and networksis. Each provides specialised functionality and for people familiar with R represent a rich set of resources.
-
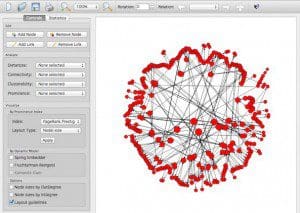
SocNetV (Social Networks Visualizer) is a cross-platform, user-friendly tool for the analysis and visualization of Social Networks. It lets you construct networks (mathematical graphs) on a virtual canvas, or load networks of various formats (GraphML, GraphViz, Adjacency, Pajek, UCINET, etc). Also, SocNetV enables you to modify the social networks, analyse their social and mathematical properties and apply visualization layouts.
-
Socioviz is a social media analytics platform powered by Social Network Analysis metrics. Allows user to query Twitter conversations and find Identify key influencers, opinions and contents. Social Network graphs (user mention and hashtag copresence) are visualized and can be exported in Gephi format (gexf) for further analysis.
-
Sentinel Visualizer is used for Advanced Link Analysis, Data Visualization, Geospatial Mapping, and SNA. Its database driven data visualization platform lets you quickly see multi-level links among entities and model different relationship types. Advanced drawing and redrawing features generate optimized views to highlight the most important entities.
-
Statnet is a suite of software packages in R for network analysis of the statistical modeling of networks. The analytic framework is based on Exponential family Random Graph Models (ergm). It provides a comprehensive framework for ergm-based network modeling, including tools for model estimation, model evaluation, model-based network simulation, and network visualization. This broad functionality is powered by a central Markov chain Monte Carlo (MCMC) algorithm.
-
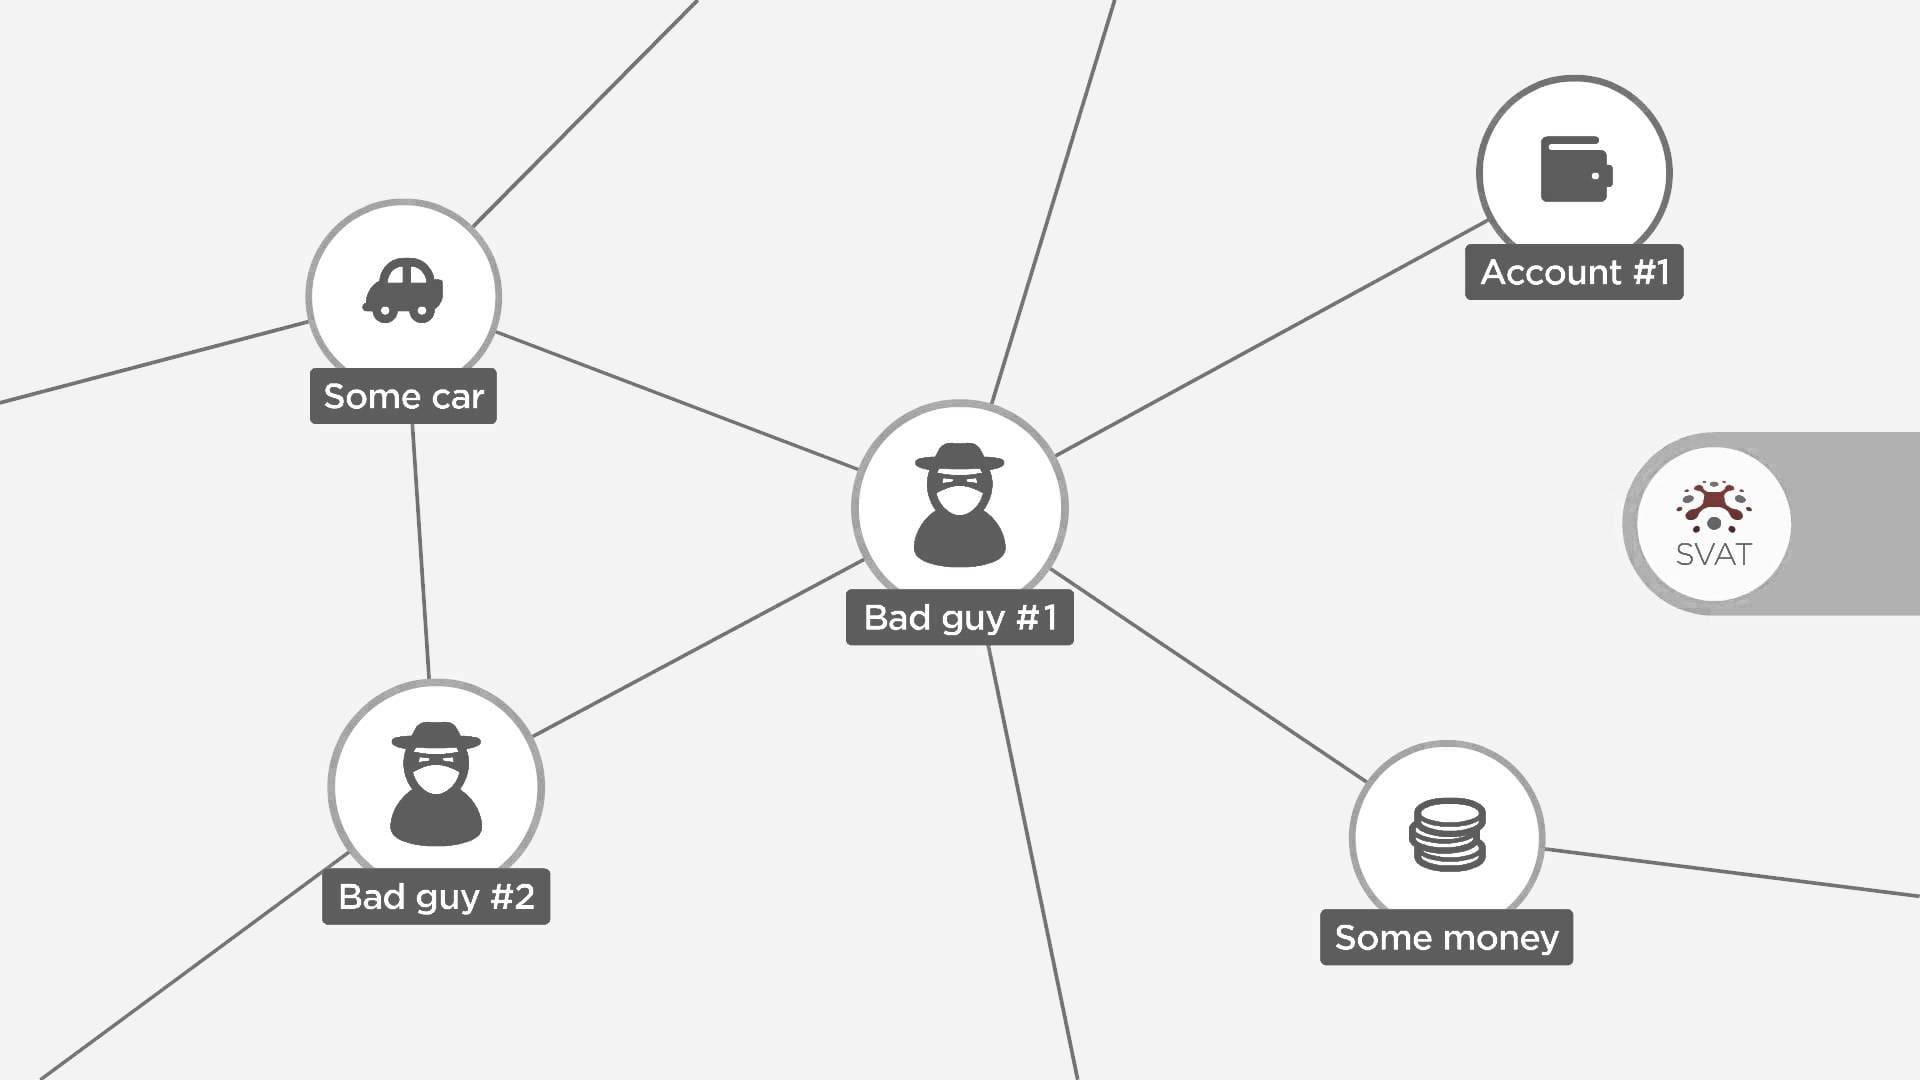
SVAT (Smart Visual Analytics Tool) is for data visualization, fraud investigation, and more. It provides user-friendly, cost-effective visualization of links and flows between subjects. A chronological overview of the visualized dataset is crucial in many cases. SVAT supports two different timeline views with a lot of options to choose from. It can mine data from structured or unstructured sources and crunches them to reveal hidden patterns.

-
Tulip is an information visualisation framework dedicated to the analysis and visualisation of relational data. It aims to provide the developer with a complete library, supporting the design of interactive information visualisation. Written in C++ the framework enables the development of algorithms, visual encodings, interaction techniques, data models, and domain-specific visualisations. One of the goal of Tulip is to facilitate the reuse of components and allows the developers to focus on programming their application. This development pipeline makes the framework efficient for research prototyping as well as the development of end-user applications.
-
Visone is a software for the visual creation, transformation, exploration, analysis, and representation of network data, jointly developed at the University of Konstanz and the Karlsruhe Institute of Technology since 2001.the main purpose of the Visone software is to empower researchers in the social sciences to analyze and visualize network data in an integrated fashion. Potential applications range from sociometry to bibliometrics and web analysis.
-
XANALYS specialise in providing powerful software capabilities. From threat assessment, Investigative major case management and advance crime and fraud analytics. It helps to manage multi-jurisdiction major crime investigations, evaluate and analyse suspicious financial transactions, capture and act upon intelligence reports, and disclose evidence in a court-ready format to ensure successful outcomes.